TrackLab setup:
Movement data with precision and ease
Getting started with TrackLab is quick and efficient, ensuring that you can begin collecting accurate, real-time data with minimal effort.
- Indoor and outdoor tracking
- Live monitoring
- Central data storage

TrackLab technical specifications
Gathering data
A fully integrated solution
TrackLab integrates with the sophisticated hardware tracking devices of renowned
manufacturers, making it a fully turnkey solution.
The resulting combination is a solution that offers accurate tracking and versatile software for analysis and feedback.
Indoor and outdoor tracking
TrackLab comes with a highly accurate Ultra-Wideband (UWB) tracking system for indoor
tracking and short-range outdoor tracking.
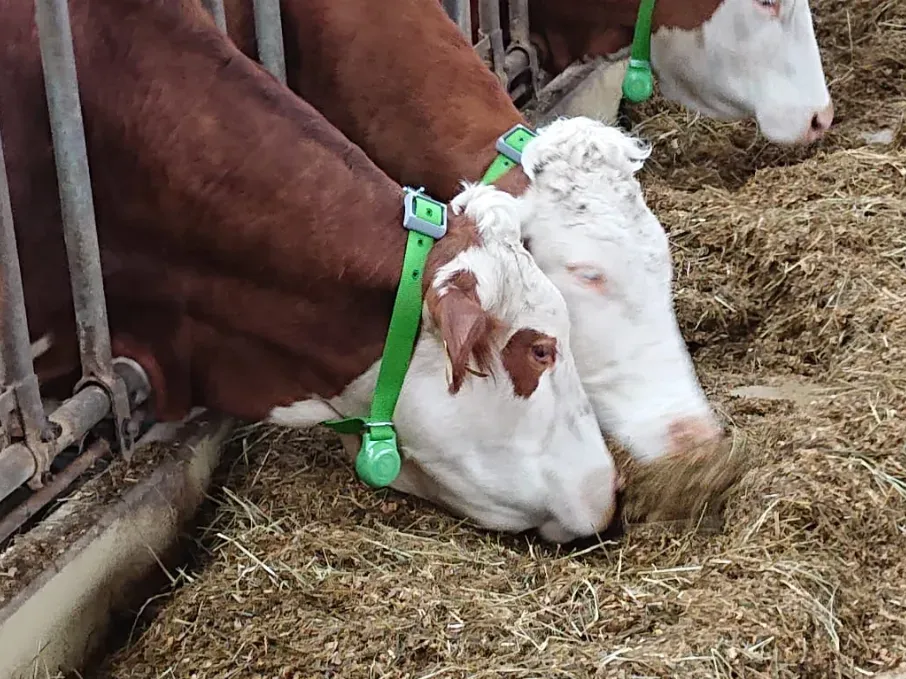
Indoors, the system can be applied in settings ranging from a controlled laboratory to a real-life barn environment.
Live monitoring
TrackLab allows for the real-time location monitoring of your animals.
The software visualizes the behavior of the animal, so you can immediately locate an animal or see that all animals are still active in the tracking location.
Central data storage
TrackLab remains the same whether you are tracking indoors
or outdoors, and regardless of the animal or tag you use.
TrackLab sends the track data from all recording sites to your private cloud for central data storage.
Our tracking method - UWB

Real-time precision at your fingertips
Ultra Wideband (UWB) tags communicate directly with wall-mounted sensors to track movement with pinpoint accuracy—even in tough environments like barns.
- Accuracy: Most systems achieve between 10-30 cm of accuracy, depending on the setup.
- Durable Design: UWB tags (54x40x14 mm, 26 grams) are designed to withstand the toughest conditions
Flexible and customizable solutions
TrackLab's UWB tags are rechargeable and customizable to suit your needs. Whether you're analyzing social behaviors that require a higher sampling rate or simply monitoring basic movement, our tags deliver.
What are the benefits of TrackLab?
TrackLab offers an intuitive platform for tracking and analyzing movement, providing real-time data visualization to streamline research in fields like neuroscience and sports science. Its flexibility and compatibility with various sensors make it a valuable tool for gaining deeper insights into behavior and performance. Click the button below to learn about the benefits of TrackLab.
All I need to know about TrackLab
TrackLab provides a wealth of resources, including tutorials, user guides, and case studies, to help users maximize the software's potential. These tools ensure that both new and experienced users can easily access support, optimize their research workflows, and make the most of TrackLab’s powerful features. Click the button below for more in-depth information.
What can I use TrackLab for?
TrackLab is ideal for a wide range of applications, from consumer and classroom studies to livestock behavior and zoo animal tracking. TrackLab is used where ever precise tracking of movement and behavior is needed. Its versatility allows researchers to study everything from human and animal behavior to group dynamics and performance analysis in real-world environments.
Ready to take the next step?
Get in touch with us today to discover how we can help you achieve your goals. Your journey to better solutions starts here.
Contact us