What is biometric research?
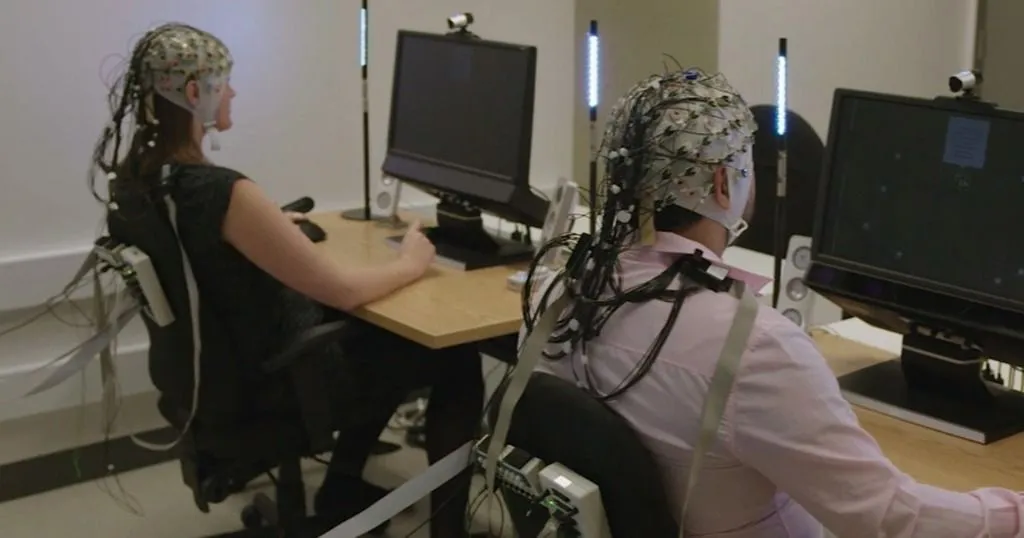
Biometric research helps scientists uncover subconscious processes related to attention, cognition, emotion, and physiological arousal.
Read More arrow_forwardItalian researchers used FaceReader to measure which message about 'staying at home' was most effective in terms of satisfaction and emotional responses.

This is a guest blog post by Maurizio Mauri, head of User Experience & Neuro-Marketing Research at SRLABS in Milan, Italy. He is kindly sharing the results of a study with FaceReader during the COVID-19 pandemic. Enjoy reading!
This is the message that we have all heard in the past few months because of the "Corona virus". Have you ever thought about the best way to communicate such an important message?
We compared three short videos of influential persons who adopt three completely different communication styles to approach the topic of the pandemic caused by the spreading of the virus called Covid-19, in order to persuade Italians to "STAY AT HOME".
The comparison of the effects of the three audiovisual messages is based on the emotional reactions of people, detected through the analysis of their facial expressions, while watching the three videos.
Take a guess… which one would be the most effective video message?

FREE WHITE PAPER
Download the free FaceReader methodology note to learn more about facial expression analysis theory.
Is it better to convey a message in a "strong way", communicated by an expert virologist (like Roberto Burioni), while being interviewed by a famous TV presenter? Does this make the message more effective and vivid?
Or is it better to perform it in a "calm way", by a famous scientific popularizer (such as Alberto Angela), who speaks in an "informal" setting?
Or rather in the "serious and institutional way", expressed by the Italian political leader, responsible for managing the crisis (the first minister Giuseppe Conte)?
Ah, of course, all in a minute only! This was the time available to expose the participants to our little research in which three audiovisual messages were shown (communicated by the three mentioned persons).
The answer about which audiovisual message was most effective, in terms of satisfaction and emotional responses, is presented here by our company SR LABS, together with our partner JUNGLES, with whom we have designed the research. The project was conducted by means of an online participation and combined the results of the innovative technique based on the automatic analysis of the emotional expressions of the face with those of a short traditional questionnaire about the perceived satisfaction.
In our research, 34 people (mainly university students from the course in "Cognitive Sciences applied to Ergonomics, User and Customer Experience", at the Catholic University of Milan, we thank the students together with all the other volunteers) were invited by e-mail to participate in the study.
After receiving a link, the participants comfortably opened each of the three videos sitting in front of their own PC while staying at home. The three audiovisual messages were presented to each participant in a random order. The random order of the exposure of the three videos allows to avoid any kind of "sequence effects".
Which messenger is preferred? The results of the analysis of the questionnaire, which explored the level of satisfaction, show that:
It is clear that a preference emerges for the "calm and informal way" performed by a scientific popularizer who is quite appreciated in Italy. Both in comparison to a virologist who takes advantage of a strong and assertive way to explain why people must stay at home, as in comparison to a political leader who must maintain the greatest seriousness within an institutional communication format.
However, so far we have measured the "WHAT", not the "WHY". To understand the "WHY", it is possible to take advantage of insights from neuroscience and experimental psychology.
From neuroscience we know that, thanks to the brilliant scientific research of Stephen Porges and his "polyvagal theory", facial expressions represent direct reactions of the nervous system (such as the psychophysiological reactions reflected by the cardiac system, the respiratory system, etc.). For this reason, facial expressions can be useful for exploring spontaneous "non-verbal" reactions, together with "verbal" and more "rational" ones (as more "reasoned" and less spontaneous) collected in the questionnaires.
From experimental psychology we know that for campaigns based on "negative emotions", such as fear or sadness, to be more effective, they must induce a moderately high level of emotion. We've learned this from the theory of the so-called "Fear Arousing Appeals", a theoretical framework commonly used in communication campaigns when a message tries to convince members of the public to adopt a more "healthy behavior".
Ideally, the negative emotion trend should describe a sort of inverted "U", where the negative emotion begins with an increase in intensity, until it reaches an apex or "emotional peak", which then returns to fall, in which there is a sort of final "relief", compared to the emotion of fear (or sadness) elicited in the initial part of the message.
By providing solutions or explanations (also known in psychological terms as "coping instructions") in the final part of the communication, it is possible to help people understand how to reduce or avoid the threat generating negative emotions. This "relief" is elicited thanks to the possibility to face or manage the danger presented in the message, thus also conveying the hope of being able to reduce or avoid the threat itself.
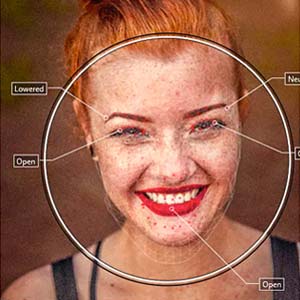
MEASURE YOUR EMOTIONS
Curious what emotions your face shows? Upload a photo here, and our FaceReader software will test it for emotionality.
The emotions reflected by faces of participants while watching the three videos were analyzed. Given the difficult general context caused by the emergency of COVID-19 and the "heaviness" raised by the new rule to stay at home for a long period, sadness (after the "neutral expression) was undoubtedly the most predominant emotional reaction, at least in absolute values:
To better understand these results in percentages, keep in mind that every emotional expression (fear, anger, sadness, joy, etc.) is revealed with a percentage ranging from 0% to 100%: an expression of joy, for example, 100% could be detected when the person finds out he/she has won the lottery!
Obviously, with the exception of special cases, it is rare for people to show an emotional expression in its maximum intensity equal to 100%. In most cases, people's facial expressions represent an "inkling" of emotional expressions (such as an inkling of a smile), a prodromal of the expressions of joy, which reveals more a slight satisfaction or contentment (what in psychology is also called "engagement"), rather than a real expression of "joy".
For this reason, when we mention emotions like "joy" or "sadness" equal to 10%, we refer to an expression that in that second or in those seconds shows an inkling of the configuration of the muscles of the face that is organized in order to express that emotion in a mild way (up to 10%).
By studying the trend of emotions during the exposure to the various videos, however, you can see different trends (like different "stories", told differently):


The graph below shows the trends of the "sad facial expression" during the three videos, with relative "trend lines" (a simple algorithm that calculates the general trend, rising or falling). Looking at the chart, notice how the green signal (Angela) is the only one that has a downward trend: sadness systematically decreases as the video is shown to participants, while the other two signals (Burioni, in red; Conte, in blue) increase progressively as an average percentage. This reveals that there is, on the contrary, an increase in percentage of expressions of sadness. On the x-axis of the graph, time is represented according to the sampling points provided by the technology (equal to 5 times per second: thus 60 seconds become 300 samples).

Another emotion is slightly elicited in all three videos: joy ("happy facial expression"). In absolute terms, we see here the average results in percentage:
However, it is interesting to consider once again the trends, related to "happy facial expressions" during the exposure to the three videos:
The graph below shows the three trends of "happy" for the three videos, with the related "trend lines". Only the one relating to Angela's video rises upwards with a rather steep "slope", signaling a significant increase in terms of percentage of joy, especially at the end of the message.

Towards the end, Alberto Angela's video message conveys words aimed at trying to show the positive effects of the adoption of the new rule that invites to "stay at home". This corresponds to the "relief" which also leads to the hope of reducing or avoiding the threat, which are reflected by the participants' facial expressions, marked by a pattern of "joy" in their face muscles equal to 10% of "happiness".
Therefore, a inkling of "joy", however enough, thanks to the high-level sensitive detection of the technology, to reveal a greater satisfaction and participation aroused by the message (the "WHY" it was more appreciated), which then mediated the levels of satisfaction ("WHAT" was more appreciated).
Another interesting result is revealed when we tried to divide the participants into two macro-age groups: young (under 25) and more "aged" (over 25): younger people respond less intensely to messages, while those over 25 years of age show intensities of emotions systematically more accentuated than younger ones. As mentioned, since the participants are mostly university students, we could only compare a dozen young subjects taken at random with a dozen over 25. Despite the small number of participants for each age group, different emotional reactions to the same audiovisual film already emerge according to the age group they belong to.
We hope to have shown the contribution of the automatic analysis of facial expressions in deepening why people can appreciate one audiovisual message more than another can. It is not just a matter of prevalence of one emotion over the other, but rather the dynamics of the trends, as learned by studying Angela's video, in which we started with a predominant emotion of sadness equal to or even greater than the other two videos, followed by the insight to see the same emotion of sadness diminishing systematically. At the same time leaving space for a new emotion rising, a growing of "contentment" and "satisfaction" (10% of "Happy facial expressions").
All this can be applied to any type of audiovisual message; actually, to any type of experience, whose effects can be assessed in terms of emotional reactions mediating the perception of liking and satisfaction.

RESOURCES
Find out how FaceReader is used in a wide range of studies and how it can elevate your research!
Biometric research helps scientists uncover subconscious processes related to attention, cognition, emotion, and physiological arousal.
Read More arrow_forward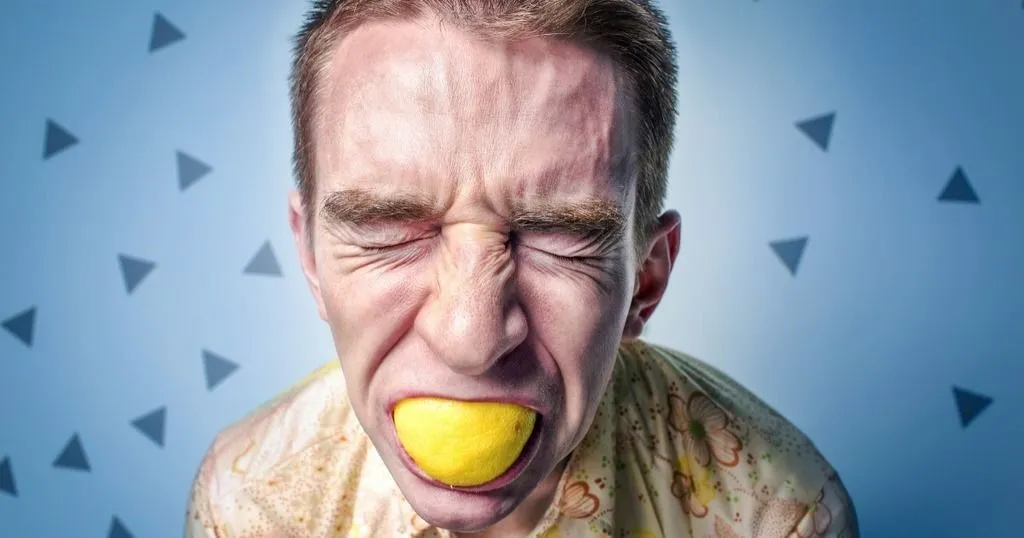
Is there a relationship between food choice and a person’s mood? Bartkiene et al. examined the factors that influence our food choice, using facial expression analysis.
Read More arrow_forward
How does emotion expression guide interactive value learning and interactive corrective action selection? Dr. Robert Lowe investigated this and shares his findings in this guest blog post.
Read More arrow_forwardWe'll get back to you shortly.
Please correct the following errors: