Into the lab: how to monitor rat social behavior
Including social behavior as part of a phenotypic screen has important benefits and eventually leads to better translational value of rodent models.
Posted by
Published on
Mon 26 Nov. 2018
Topics

This is a second guest blog post by Suzanne Peters, PhD. Her thesis is named "The importance of rat social behavior for translational research. An ethological approach", which she defended on April 4th this year. Read the first blog post here.
Monitoring and analyzing the social behavior of group housed rodents is something that many researchers find extremely challenging. It can also be very time consuming. However, including social behavior as part of a phenotypic screen has important benefits. As I argued in my first blog, it eventually leads to better translational value of rodent models. During my PhD research, I have developed an automated analysis that allows for the monitoring of socially interacting rats.
Research equipment
In my experiments, I used an enlarged version of the PhenoTyper (90 x 90 cm, called PhenoTyper-9000) to allow for social housing of rats. Additionally, this PhenoTyper is equipped with ultrasonic microphones to customize tracking software as well as ultrasound recording software to automate behavioral analysis, including ultrasonic vocalizations of socially interacting rats. In the long run, my aim is to fully synchronize the ultrasonic vocalizations with the (visible) behavior of the animals. This is important because analysis of these vocalizations can provide more insight into the emotional states driving social behavior.
Setup
At the start of an experiment, two rats are placed simultaneously inside the PhenoTyper-9000. For identification purposes, both rats are marked with either black or red on their backs. Due to the infrared lighting and infrared filter on the camera, in the video image only one animal has a visible (black) mark. Videos of the behaving animals are stored and afterwards processed with the help of EthoVision XT. Simply said, the path of each individual animal is stored, and from that data other behavioral parameters, such as speed and distance between the animals, are extracted. We did so with help of customized algorithms programmed in Matlab.
Behavioral analysis
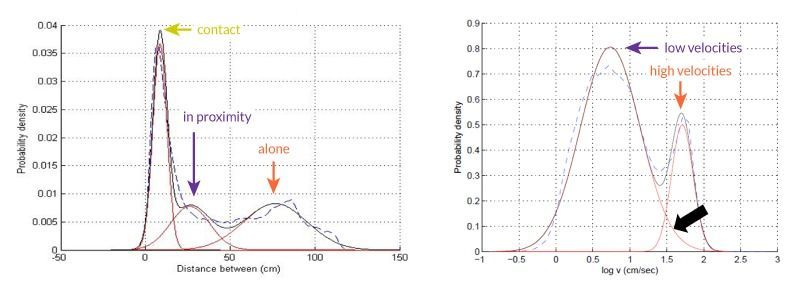
Next, behavioral analysis of these parameters (distance and speed) follows. My analysis is based on the original idea of Prof. Ilan Golani and co-workers (e.g. Drai et al., 2000). Basically, it consists of the analysis of frequency distributions of the parameters and subsequent classification of behavioral modes according to Gaussian curves that best represent the data. I will explain this with help of the figure below.

The figure is an example to illustrate the basic concept of the analysis that leads to the “social modes.” On the right, we see the frequency distribution of all samples containing a certain velocity, and on the left for all samples the distance between the animals (proximity). The blue dashed line represents the empirical data while the red lines are the Gaussian curves that are plotted on the empirical data. The intersection of the red lines, highlighted with the black arrow, are used as threshold for determining the different modes.
“Social modes”
Using the thresholds determined by the intersections, I have categorized three distinct “social modes” of inter-individual distances: ‘contact,’ ‘in proximity,’ and ‘alone.’ In one of my studies, we could find effects of pharmacological treatments and environmental manipulations on these modes. This further strengthens the idea that these modes are indeed representing the social behavior of the rats. Additionally, the behavioral modes are consistent with the categories obtained with human scoring of these behaviors (hand scoring of the same experiments). Therefore, automated recognition of patterns in social behavior is a powerful tool for data analysis. For details, see Peters et al., 2016.
Example of pharmacological effect on social behavior
The next step was to implement this approach in an existing model for reduced social behavior, the chronic phencyclidine (PCP) model. The results of this study (Peters et al., 2017) showed that PCP treated animals spent less time in each other’s proximity after 3 or 4 days of chronic treatment, regardless of being exposed to a familiar (cage) partner or unfamiliar partner. Particularly, time in proximity when moving with high velocity was reduced for PCP treated pairs. In contrast, at long-term, PCP treated animals spent more time in contact when exposed to an unfamiliar partner as compared to SAL treated rats. However, this difference was not observed when exposed to a familiar partner. This illustrates that effects of pharmacological treatment on social interaction behavior may be more subtle than they might appear at first glance.
Future directions
Eventually, evaluating the social behavior of animals using an objective, ethological, and automatic approach must contribute to understanding the complex mechanism driving social behavior. As a result, the translational value of our models increases, which will facilitate better research strategies for understanding and eventually treating human psychological diseases that involve reduced or abnormal social behavior.
References
- Drai D, Benjamini Y, Golani I. (200). Statistical discrimination of natural modes of motion in rat exploratory behavior. Journal of Neuroscience Methods, 96, 119–31.
- Peters, S.M.; Pinter, I.J.; Pothuizen, H.H.J.; Heer, R.C. de; Harst, J.E. van der; Spruijt, B.M. (2016). Novel approach to automatically classify rat social behavior using a video tracking system.Journal of Neuroscience Methods, 268, 163–170.
- Peters, S.M.; Tuffnell, J.A.; Pinter, I.J.; Harst, J.E. van der; Spruijt, B.M. (2017). Short- and long-term behavioral analysis of social interaction, ultrasonic vocalizations and social motivation in a chronic phencyclidine model.Behavioral Brain Research, 325, 34-43.
- Previous blog post from Suzanne Peters: Towards automated homecage monitoring of group housed rats.
Related Posts
Zebrafish attracted to superfish: video tracking sex differences in shoaling

Why wolves cry out for their friends

