Did you know about these tips and tricks in EthoVision XT?
Whether you are a seasoned user of EthoVision XT or just starting out. There is always an opportunity to learn more about the best video tracking software available.
Read More arrow_forwardTips and tricks on using EthoVision XT in the Morris Water Maze. Measuring spatial learning and memory, cognitive flexibility with automated tracking software.
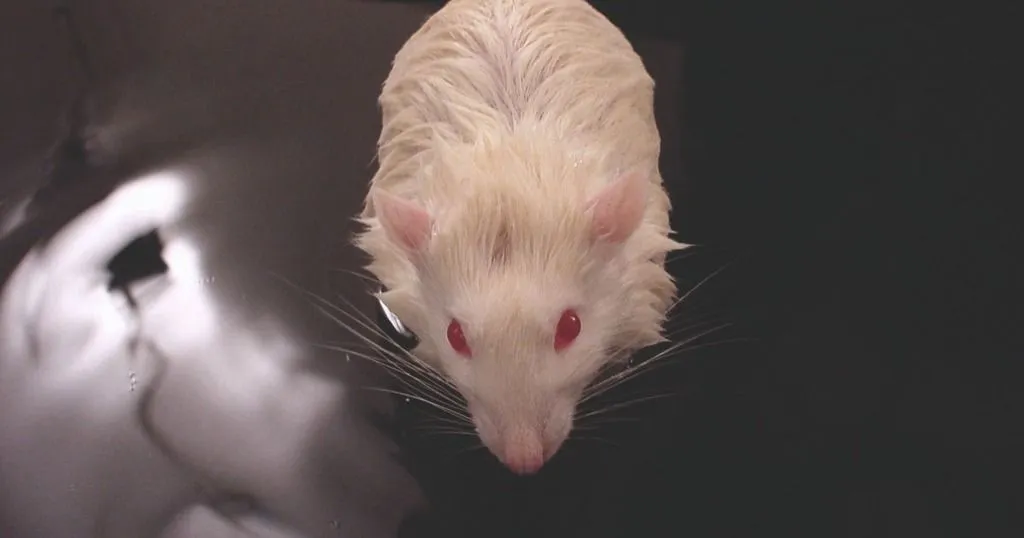
The Morris Water Maze, developed in 1981 by Richard Morris [1], is a tried and true method for assessing spatial learning and memory in rodents.
The task involves a large circular pool filled with opaque water (typically colored with milk or nontoxic paint). A platform is than placed somewhere in the maze, below the level of the water so the rodent cannot see it.
There are a variety of protocols for how to run this test, but typically the protocol involves placing the rodent in the water from varying entry points, then measuring the amount of time it takes to reach the platform. If the animals do not reach the platform in 60 seconds, they are guided towards the platform and removed. After a certain number of these training trials, a probe trial is completed. In the probe trial, the platform is removed, and the amount of time the rodent spends swimming near the platform is quantified.
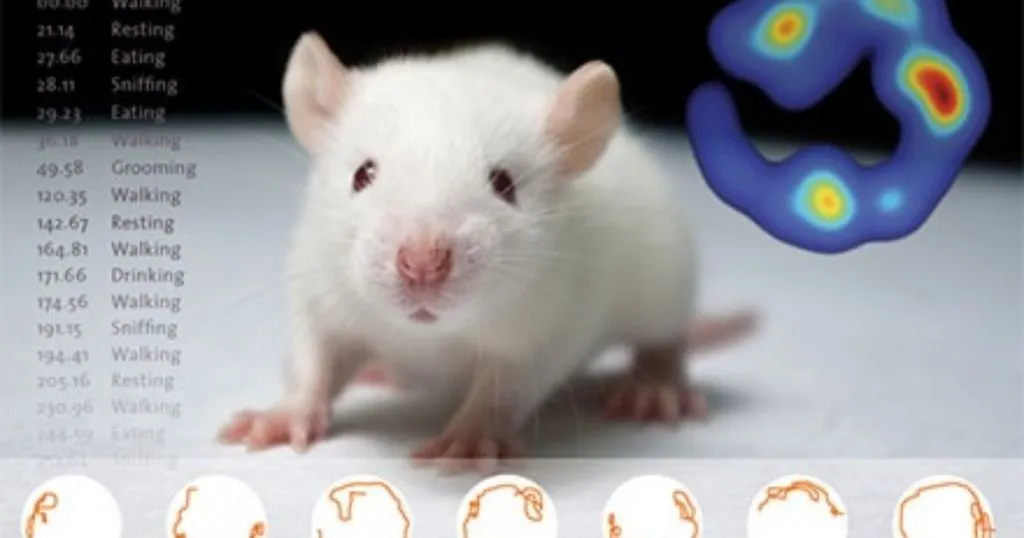
When Richard Morris first started tracking the rodents in the maze, it required a complex system of an image-analyzer and a microcomputer to monitor degrees of contrast - the black head of a hooded rat against the white milk colored water.

Once your data profile is complete, go to Heatmap Visualization and click Group Mean on the right. This will merge your group data to create a Heatmap for your two distinct groups. You can then overlap important maze features by going to Show/Hide in the top right, and selecting Arena Features. The resulting image is a great way to emphasize group changes for your papers, presentations and posters.
To get started using EthoVision XT, or for more tips and tricks, contact your regional account manager!

FREE TRIAL:
References
[1] Morris, R.G.M. (1981). Spatial localization does not depend on the presence of local cues. Learning and Motivation. 12, 239-260.
[2] Morris, R. (1984). Developments of a water-maze procedure for studying spatial learning in the rat. Journal of Neuroscience Methods, 11, 47-60
Whether you are a seasoned user of EthoVision XT or just starting out. There is always an opportunity to learn more about the best video tracking software available.
Read More arrow_forward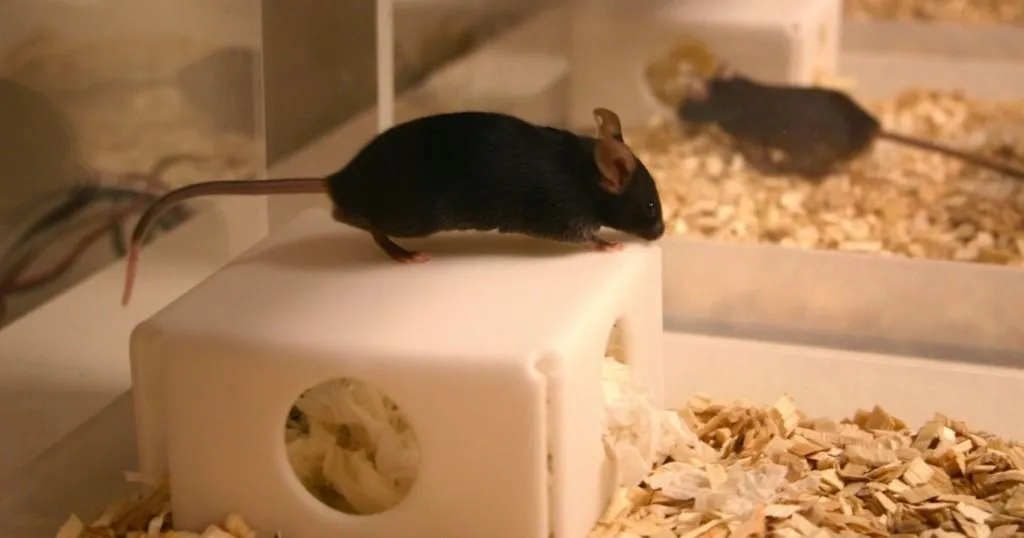
Many labs use video tracking software to increase the efficiency of their research. In fact, EthoVision XT video tracking software has just reached an impressive milestone: 2000 sites worldwide.
Read More arrow_forward
Mouse models are essential for neuroscience research. Many tests are susceptible to bias. Home cage testing provides a number of solutions.
Read More arrow_forwardWe'll get back to you shortly.
Please correct the following errors: