EthoVision: Effortless setup for faster results
EthoVision's setup process is designed with efficiency and flexibility in mind, so you can focus on what truly matters—your research.
- Experiment templates to get started in a few clicks
- Detection settings built on deep learning technology
- Arena definition to define any arena or zone of interest
Which hardware do I need?
Minimum PC specifications, same or better specifications required
- Windows 11 (64-bit) Professional
- Mid or Full tower (tested on a Dell Pro Max Tower T2), NO Mini or Small Form Factor (SFF)
- Processor – Intel Core i7-14700 (20 cores, 2.1-5.4 GHz) or better
- Internal memory (RAM) – 32GB (desktop); 16GB (laptop)
- Graphics card (GPU) – NVIDIA GeForce RTX 5060 or 5070 (12 GB VRAM, physical GPU required, embedded GPUs are not supported)
- 1 GB Network card (for GigE cameras)- tested on a Basler GigE Interface Card, Adlink PCIe-GIE74, and FS X550AT2-2TP (10G NIC). For laptops, an onboard 1 GB NIC
- Hard disk - 1 TB free space (to store experiments including video files)
Deep learning relies on the CUDA computing platform. For this reason, the GPU driver must support CUDA version 12.2.
Supported specifications
EthoVision is the core of your lab, providing
efficient,
reliable data collection and analysis for your experiments. We aim to make it easy to use,
without technical worries.
For deep learning users, a more powerful GPU is essential to handle complex computations.
Investing in the right hardware ensures better data and more reliable results.
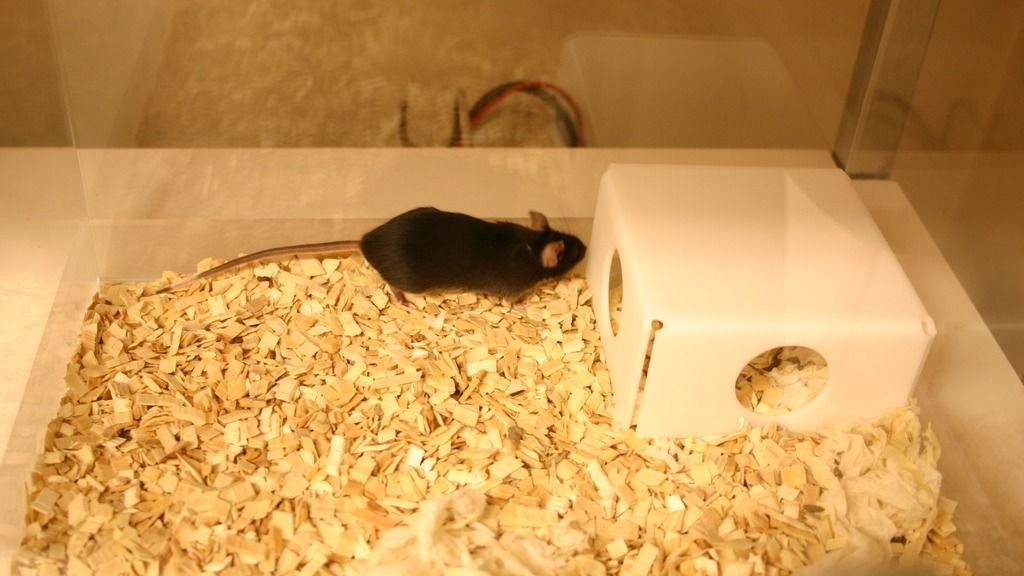
EthoVision is able to detect and quantify mouse behavior in an unbiased way, better than biologists seeking answers to scientific questions
DR. D.P. MOHAPATRA
WASHINGTON UNIVERSITY SCHOOL OF MEDICINE, USA
Your research your way
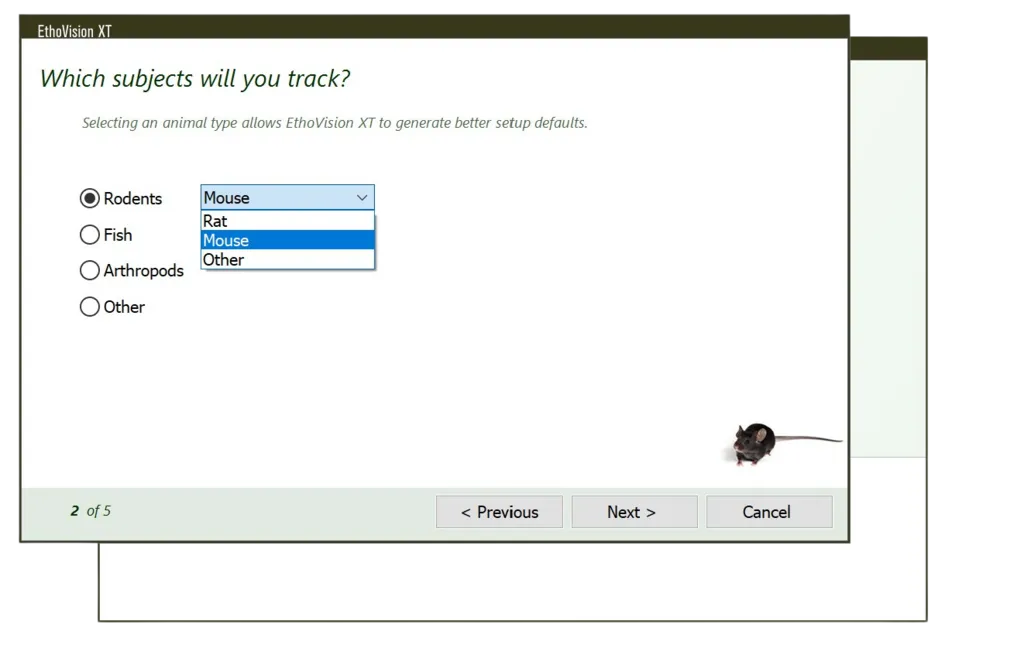
Easy experimental startup
EthoVision makes setting up experiments straightforward with pre-configured templates and automatic detection settings. This helps reduce setup time, allowing you to focus more on your research.
Trial list and data management
Organizing your trial list with key variables like age, treatment, and identification number ensures easier data selection and analysis, helping streamline your research workflow.
Customize your arena and zones
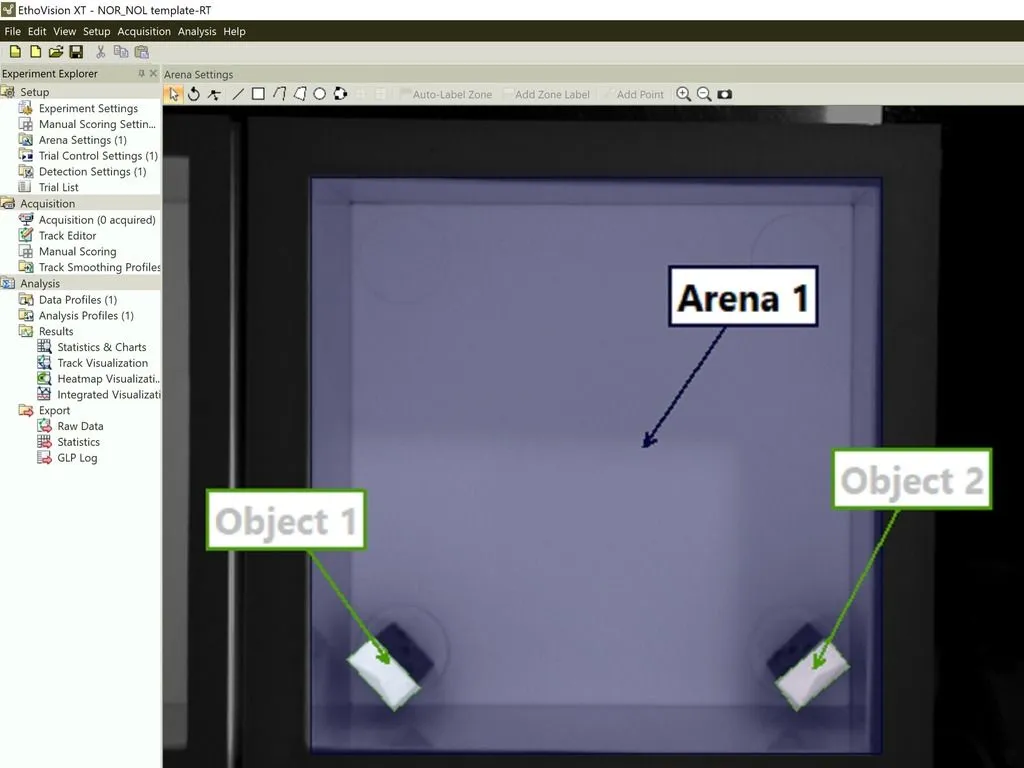
EthoVision makes it easy to track movement from prerecorded videos or live camera feeds. Whether you're working with an open field or a radial arm maze, setting up your arena is as easy as four simple steps:
- Grab an image: Use a camera or video as your template
- Calibrate: Provide the arena size for accurate calculations
- Draw the arena: Use intuitive tools to define tracking areas
- Draw zones: Highlight areas of interest like objects or shelters, and create customized zones
Want to use EthoVision with DanioVision? Zone definition for a well plate is done
automatically, making setup even easier.
This makes the process fast and ensures accurate tracking from the start.
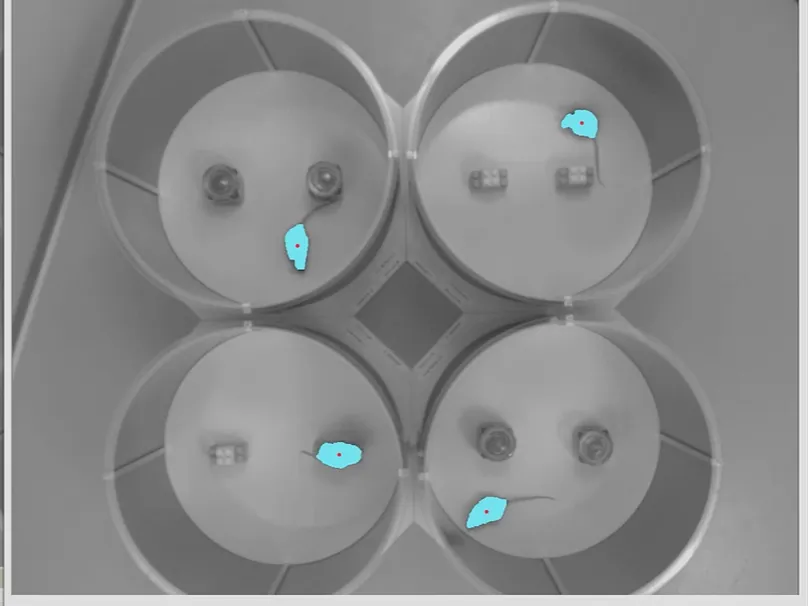
Automated animal detection
EthoVision features automated detection settings that make
tracking easy and highly accurate. Using trained neural networks and subtraction-based detection,
EthoVision adjusts for lighting conditions, background noise, and subtle movements, ensuring
robust tracking without manual adjustments.
This automation simplifies your workflow, allowing you
to focus on your research rather than fine-tuning settings, and ensures consistent results even in
more complex environments.
Whether you're working with rodents, zebrafish, or other
animals, EthoVision's automated detection ensures smooth, reliable tracking from the start.
All I need to know about EthoVision
EthoVision has been cited in tens of thousands of publications, in a great variety of studies, from cognition, learning and memory to emotional and social behavior, stress, anxiety, fear and many more. Click the button below for more in-depth information on how EthoVision.
What does EthoVision cost?
EthoVision comes in three packages adapted to your needs and price point. This means that there is always an EthoVision that works for you. From simple tests to large multi-system setups. Click the button below to find the ideal package for you.
What are the benefits of EthoVision?
EthoVision is made for researchers, by researchers. It saves time and gets you the results you want (and need) with ease. Designed to be at the core of your lab, EthoVision offers integration of data and automation of behavioral experiments with any animal. Click the button below to learn about the benefits of EthoVision.
What can I use EthoVision for?
EthoVision is a thoroughly validated video tracker which can be used for rodents, fish, insects and other animals. It also serves as the engine for our hardware solutions such as DanioVision and the PhenoTyper; flexible observation cages to take your research even further.
Ready to take the next step?
We’re passionate about helping you achieve your research goals. Let’s discuss your project and find the tools that fit.
Contact us