EthoVision XT
Data analysis
Graphs, tables, and heatmaps are a great way to showcase your results. However, integrated visualization of your data (tracks superimposed on the video file), can also be very helpful in the beginning steps of analysis, because it gives you a good feel for the data.
Visualizing your data
Additionally, when you are interested in certain behaviors such as body elongation or mobility, use the visualization function to fine-tune the thresholds for these behaviors.
Want to show others? With the built-in screen recording tool you can make a video of the integrated visualization.
EthoVision XT is the most widely applied video tracking software that tracks and analyzes the behavior, movement, and activity of any animal.
-
A cost-effective solution for all standard behavioral tests such as the Morris water maze and open field testing
-
High-throughput and high-content testing
-
Suitable for sophisticated test-protocols
High throughput tracking
Use multiple arenas for high-throughput testing. Here is a great example of tracking results of small aquatic species in multi-well plates (The Neurotox laboratory, Wlodkowic Lab, Australia).
Data smoothing
In any tracking system, there are three sources of noise that potentially skew the values of dependent variables such as distance moved or velocity; system noise, outliers, and small movements of the animal (body wobble). EthoVision XT includes tools to smooth out your data.

Data selection
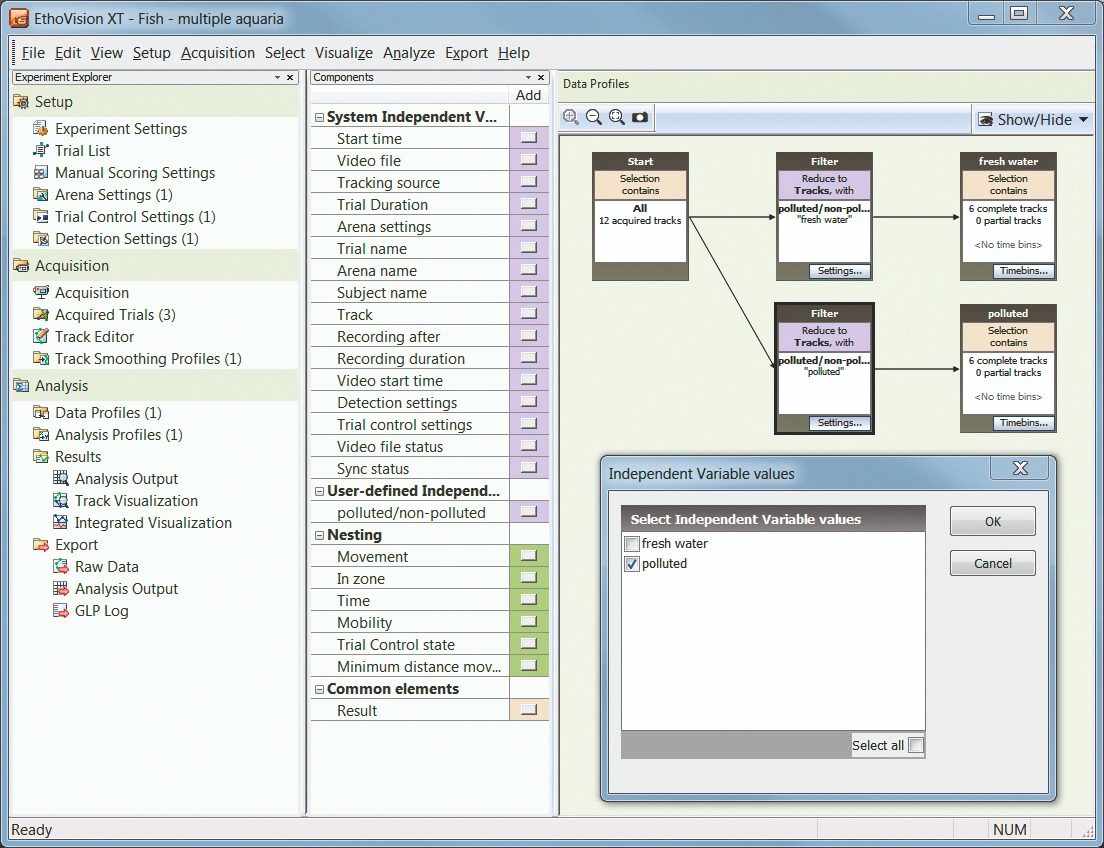
Data selection tools let you evaluate certain subsets of each trial. Selecting the data, for example, in which animals received a specific treatment. Or nest your data on time, behavior, or physiological state.
Analysis profile
The number of parameters for analysis is substantial, such as: velocity, turn angle, mobility, proximity, rotations, etc. Basic statistics are also provided, such as mean, variance, standard deviation, and standard error.
All external data integrated into your EthoVision XT project and trial control variables (lever pushing, lights on, door opening, etc.) can be analyzed in a similar (integrated) manner.
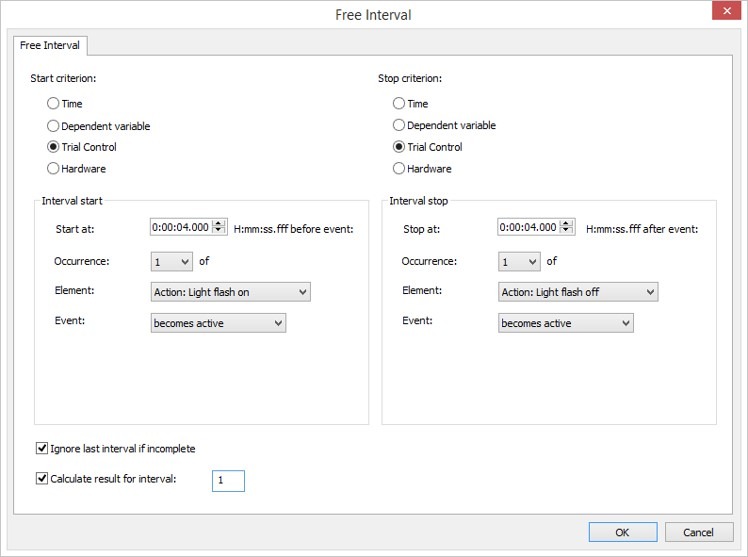
Free interval selection
Free interval selection is useful in answering questions like “How much time did the animal need to get 3 correct lever presses?” or when comparing the subjects’ behavior before and after the stimulus was presented.

Creating custom variables
Extract all the information you want from your tracking data, using JavaScript code to create your own dependent variables. For example, count the number of subjects in a certain zone, measure body length based on distance between nose and tail, or mark the time when more than 80% of the zones have been visited by you subject.

"EthoVision XT has allowed our group to significantly cut down the time spent analyzing behavior."
Dr. O. Fernández Gayol |Universitat Autònoma De Barcelona

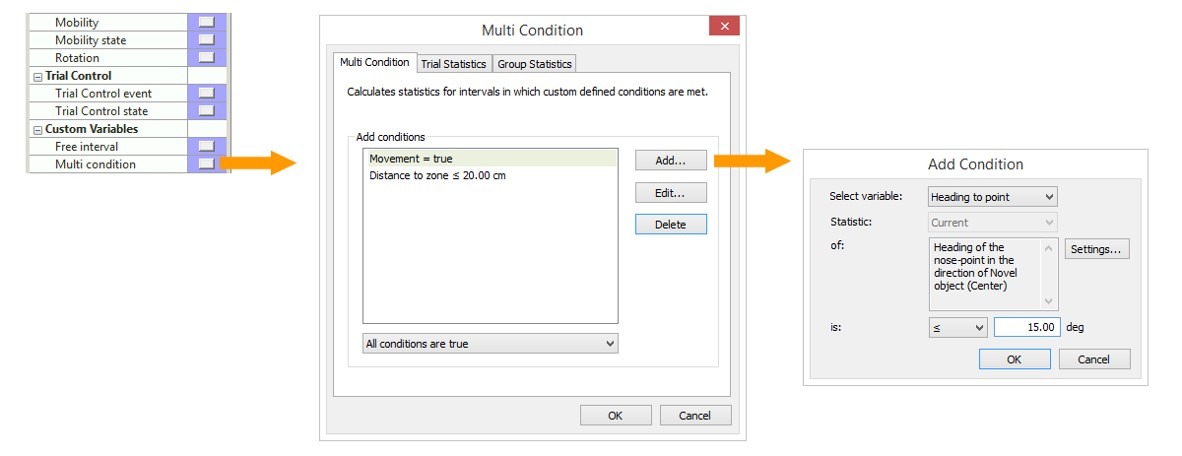
Build your own parameters
In a novel object test, you are interested in how animals explore objects. The proximity of the nose point to object is an indicator, but combining this with other parameters, such as animal movement and head direction, provides more accuracy. Combining these parameters creates a new “multi-condition variable”.
Automatic and batch analysis
After selecting which parts of your data need to be analyzed, and the independent variables you are interested in, EthoVision XT will automatically analyze your data according to these settings right after the trial has ended or, in the case of batch analysis, after the selected trials have been acquired.
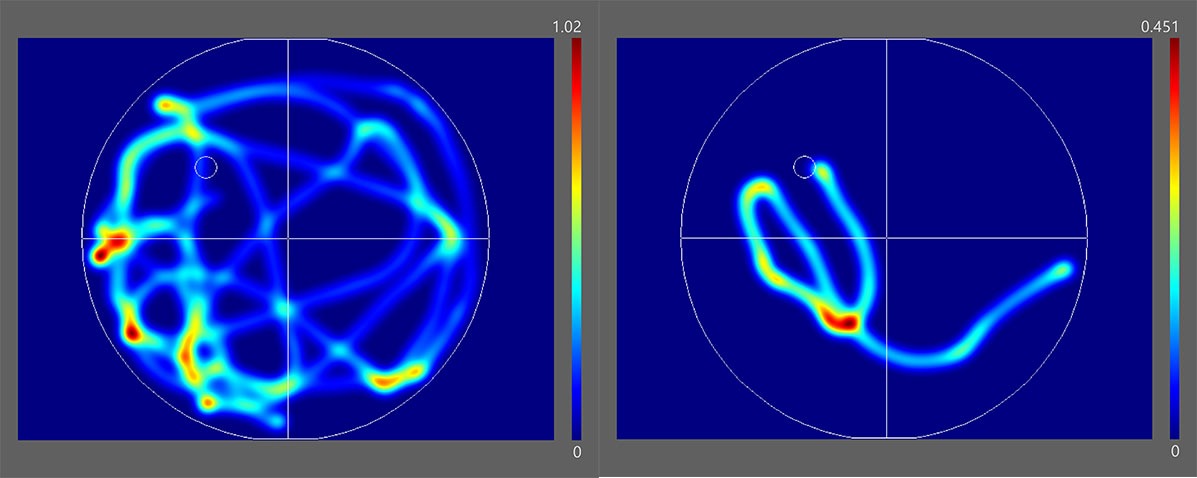
Heatmaps
In addition to integrated visualization, a heatmap gives you an intuitive and unique view of your data. You can export these at high resolution (including a minimum-maximum scale) for use in presentations and publications.

Group statistics and charts
Compare the results between treatment groups by using graphs. You can organize and adjust the designs of these graphs and export them in any standard format (PNG, JPG, BMP, GIF).
Results are also presented in tables, of which you can adjust the layout. This is ideal if your statistical program requires a certain set-up of the data, you can organize and export your table accordingly.
 English
 German
 French
 Italian
 Spanish
 Chinese