 English
 German
 French
 Italian
 Spanish
 Chinese
TrackLab
Data analysis
Use TrackLab to quantify spatial behavior and gain insights into consumer behavior, place-preference, or social interactions.
Data analysis
You can also analyze your data for individual subjects and experimental groups, or discover many more parameters within spatial behavior.
TrackLab™ is the complete tracking solution for your research on human behavior. Save time on data collection and analysis, and obtain real-time insights into a wide range of spatial behaviors.
-
Rely on highly accurate tracking data for your research
-
Gain insights into social interactions and consumer behavior
-
Easily access, collect, analyze, and visualize your data
Movement indicators
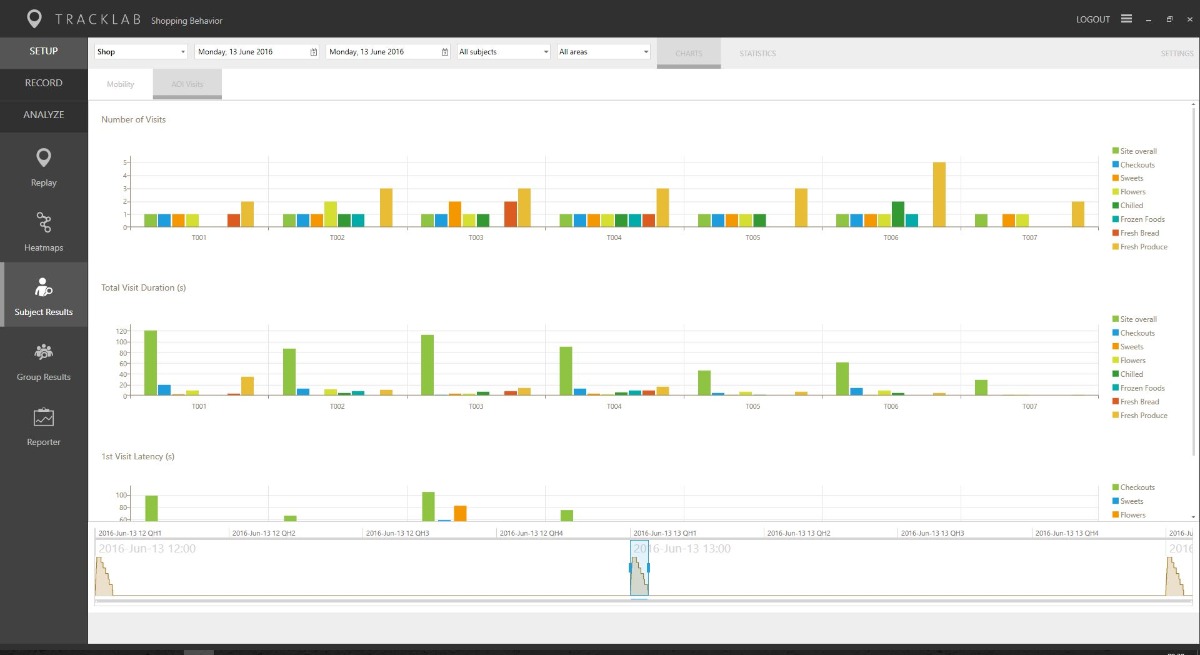
Movement indicators
Movement is measured with parameters of velocity, distance, and type of activity (standing, walking, running). You can calculate results for the complete data selection or choose the time interval you want to review.
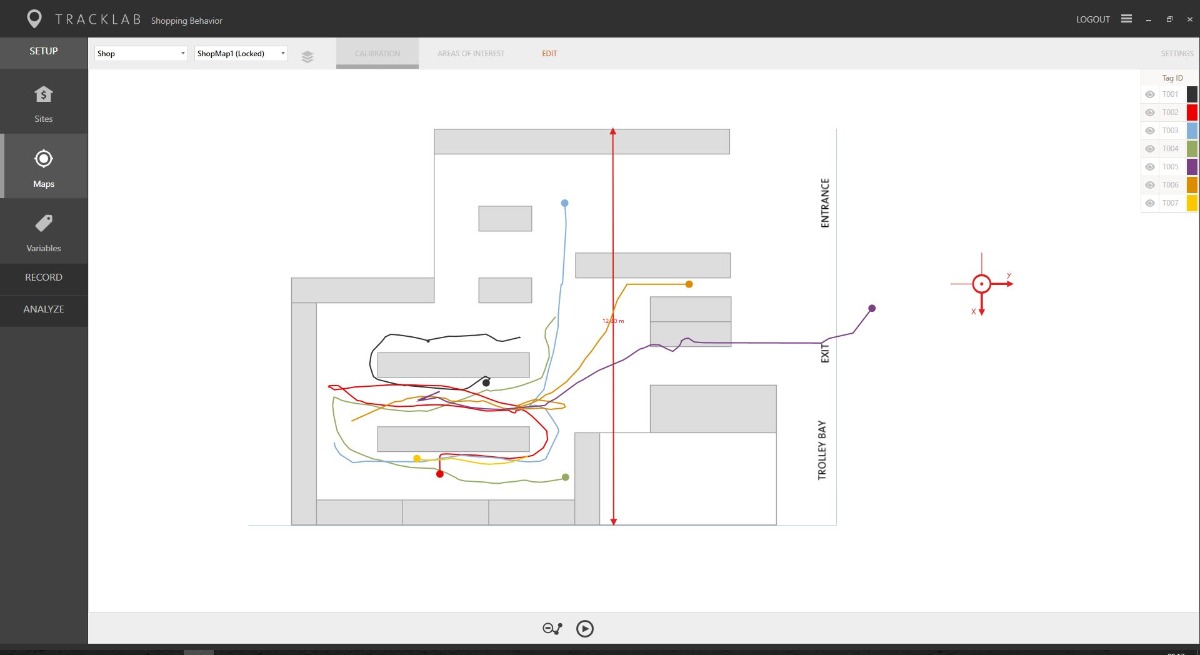
Areas of interest
You can pan and zoom across the map and draw custom regions of interest. This way, you can get the frequencies and durations of subject visits for each of the defined areas. Ideal for when you want to study different floor concepts of shops, classrooms, or hospital rooms.
Individual and group behavior
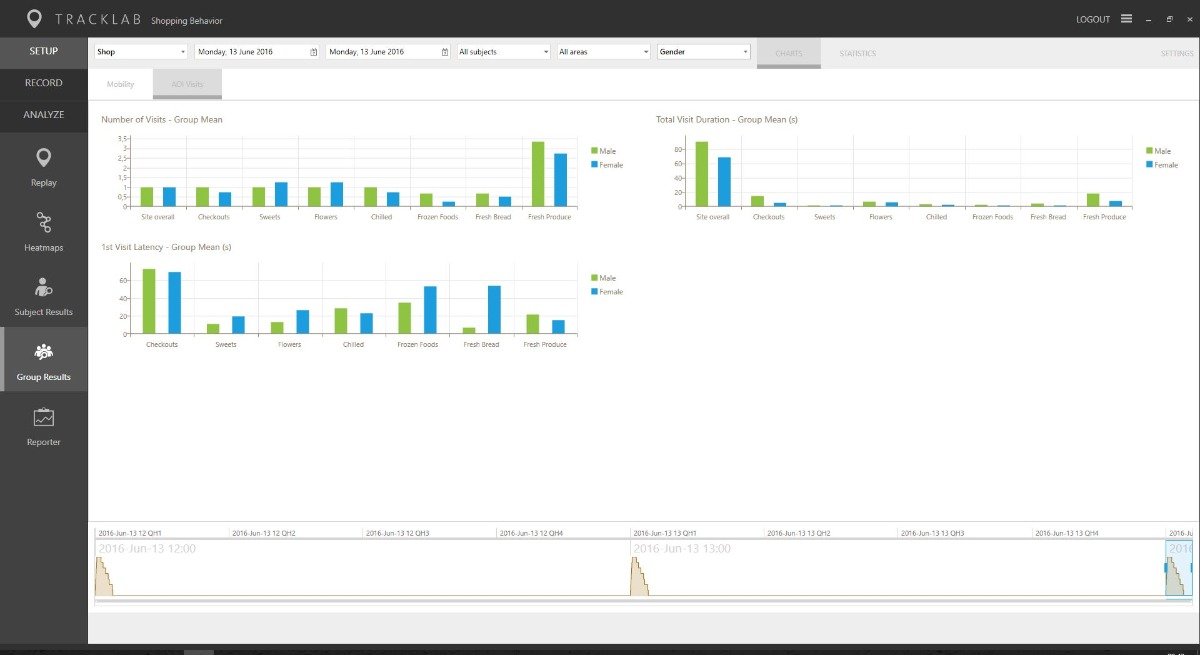
Individual and group behavior
You can examine the behavior of individuals in detail and add characteristics information for each subject. TrackLab also offers the option to explore results for experimental groups. When you add information to define the groups in the Variables module, TrackLab automatically calculates group statistics in the Group Results module.
Choose your time interval
Examine results for a complete selected time interval, or view results per minute, hour, day, or per larger intervals. This way, you can analyze changes over time and gain meaningful insights.
Real time live monitoring
Data export
The TrackLab software is based on an ‘open solution’ concept, meaning that processes are transparent. Furthermore, all data can be exported for custom processing with your preferred mathematical or statistical tool.
Want to learn more?
Find resources about TrackLab or learn about how TrackLab can benefit your research!