Understand behavior as it truly happens
The Observer
You want your observations to be structured, reliable, and rigorous. The Observer is the leading platform for coding, analyzing, and managing behavioral data in scientific research. From designing detailed coding schemes to capturing live or video-based observations and transforming them into structured datasets ready for statistical analysis and publication.
Efficient coding Structured, reliable data capture
Advanced analysis Reveal patterns and sequences
Publication ready Cited in scientific literature
Design. Observe. Analyze.
Design your coding scheme
Build structured coding schemes that match your research design, from simple event logs to complex behavioral frameworks.
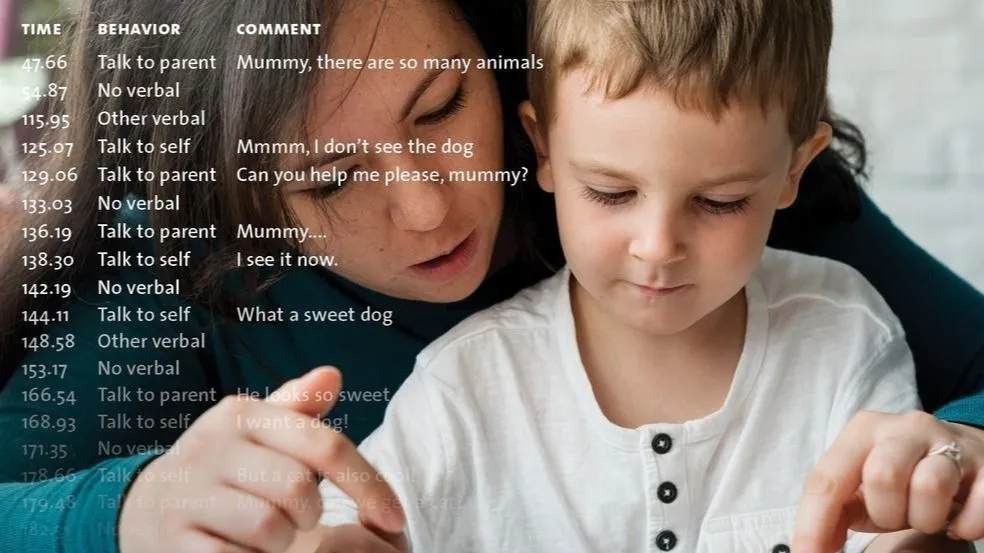
Capture behavior precisely
Record live or use pre-recorded videos and code events, states, and interactions with frame-level accuracy.
Analyze and export data
Explore sequences, durations, and co-occurrences, then export structured datasets for statistical analysis.
Get The Observer for your lab
Professional software for coding and analyzing observational data in human behavior research.
Essential
Custom pricing
Tailored to your research needs
Code live or from multiple videos
Includes advanced analyses like inter-rater reliability
Best for early-stage projects and budget-conscious teams
Advanced
Custom pricing
Tailored to your research needs
Everything in Essential, plus:
MediaRecorder for synchronized video collection
2 Coder Licenses for parallel coding and team collaboration
Premium
Custom pricing
Tailored to your research needs
Everything in Advanced, plus:
3 Main seats and unlimited Coder Licenses
External data & E-Prime for integration and synchronization
Build your complete solution
Hardware
Choose a laptop with an integrated webcam for a flexible and portable solution, or opt for a workstation with a webcam for a more robust setup suited to dedicated research environments.
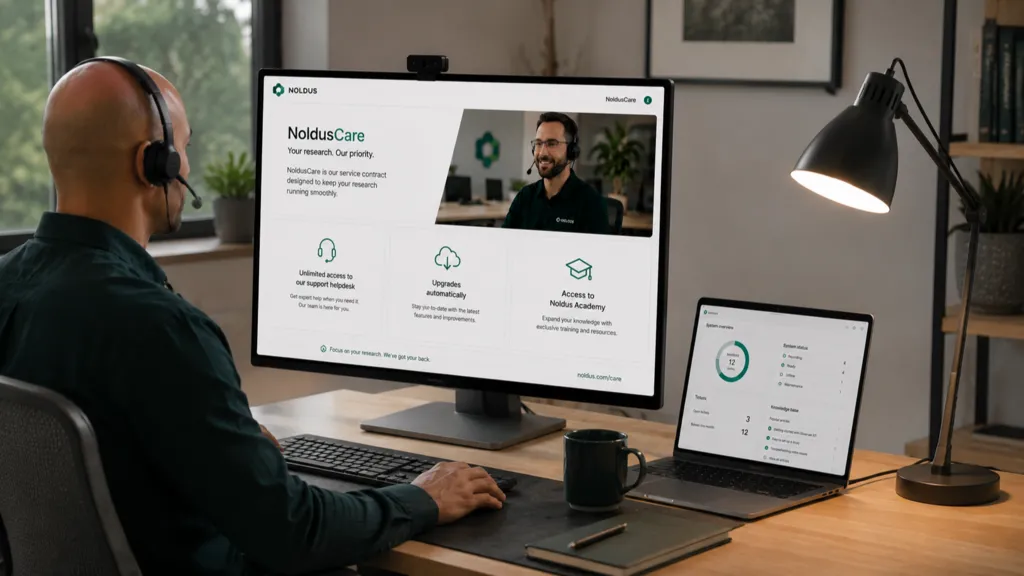
NoldusCare
Add an additional year of NoldusCare to keep your software performing at its best. Includes the latest features, ongoing technical support, and access to the Noldus Academy. The first year is included free of charge.
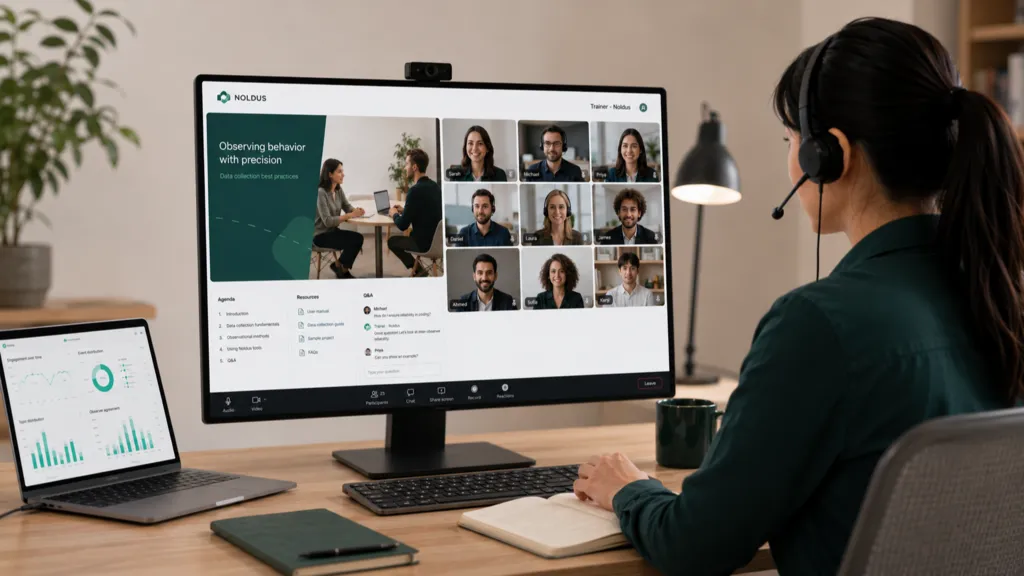
Remote training
Ensure a strong start with our remote training sessions. Led by experienced Noldus trainers, these sessions help you quickly become familiar with the software. The fastest way to start working efficiently from day one.
Hardware Options
Laptop with integrated webcam
Start recording immediately with a simple setup and no additional hardware required.
Price on request
Laptop with webcam and USB extender
More flexibility in camera positioning with higher image quality for reliable recordings.
Price on request
Workstation with webcam and USB extender
A robust setup suited to dedicated research environments with maximum performance.
Price on request
Additional NoldusCare
NoldusCare for The Observer Essential
Extend your NoldusCare coverage by one additional year for The Observer Essential.
€ 250.-
NoldusCare for The Observer Advanced
Extend your NoldusCare coverage by one additional year for The Observer Advanced.
€ 500.-
NoldusCare for The Observer Premium
Extend your NoldusCare coverage by one additional year for The Observer Premium.
€ 1,000.-
Remote Training
Essential remote training
2 hours of remote training for a maximum of 5 participants
€ 300,-
Advanced remote training
5 hours of remote training for a maximum of 15 participants
€ 900,-
Premium remote training
1 full day of remote training, unlimited participants
€ 1.750,-
Structured behavioral analysis
Features that simplify your work
Understanding behavior requires more than recording what happens. It requires a structured approach that connects study design, observation, analysis, and data integration in one coherent workflow.
Time-based precision
Analyze how behavior unfolds over time, revealing patterns, transitions, and meaningful sequences.
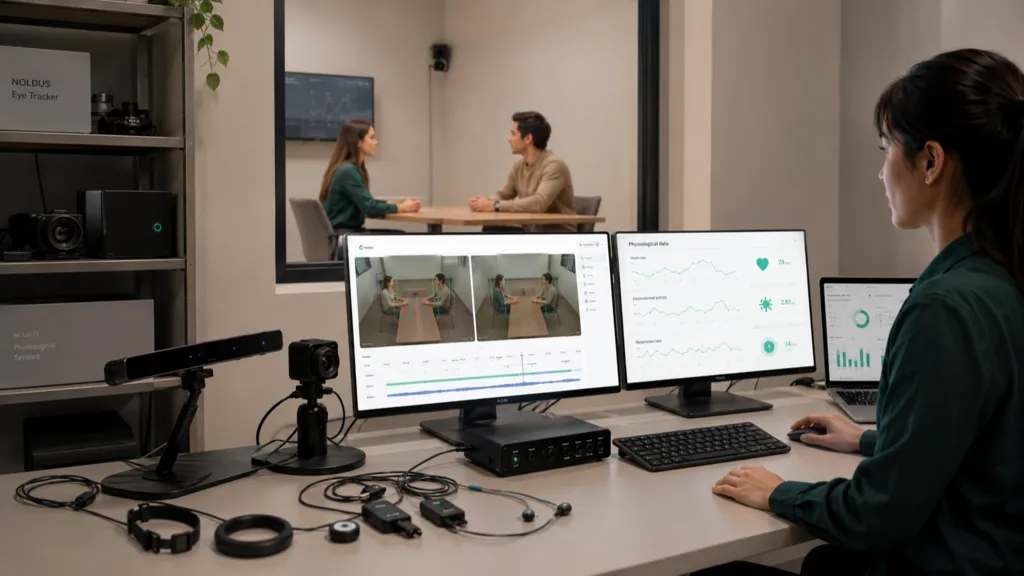
Multimodal integration
Synchronize behavioral data with different types of data such as facial expressions, eye tracking data, physiological signals, EEG data and screen captures in one unified timeline.
Clear visualizations
Generate graphs and visual summaries that reveal trends, durations, and behavioral structures at a glance. Visualizing your data helps you understand it better and lets you create professional figures for your publications.
Bias-resistant analysis
Observations by different coders (inter-rater) are compared record by record. The software reports Cohen's Kappa, agreements, and disagreements, and supports intra-rater reliability as a basic quality check.
Publication power
Boost your chances of getting published in high-impact journals by using The Observer, the most trusted tool for behavioral research. Trusted as the gold standard in over 15,000 peer-reviewed studies.
See The Observer in action
Short videos showing how researchers and professionals use The Observer
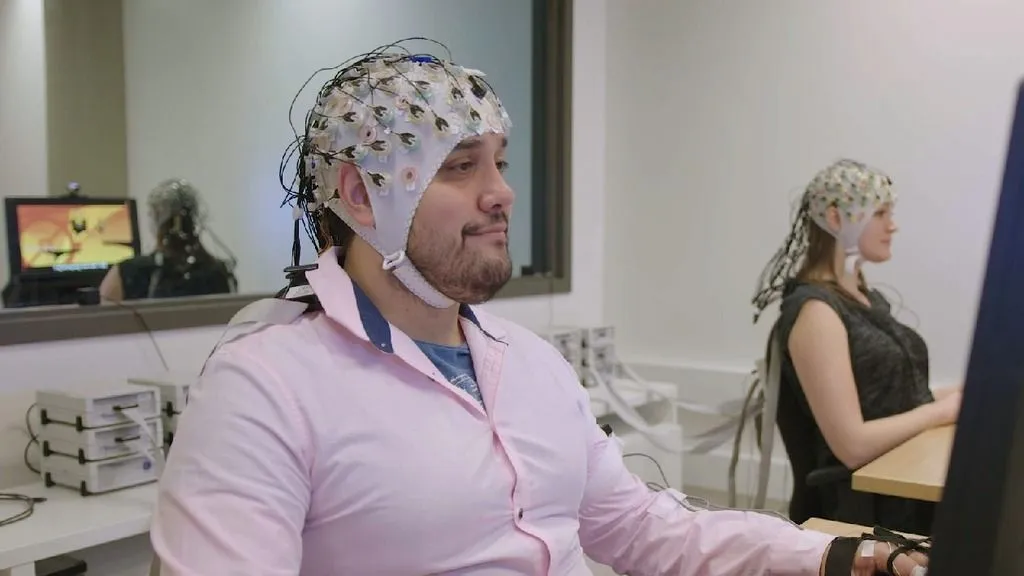
Neurolab - Université du Québec à Montréal
Studying educational research
One of the unique qualities of this educational neuro-lab is its capability to study two persons in interaction, for instance during video gaming. Both of them are being studied at the same time: EEG and video signals are recorded, as well as eye tracking data.
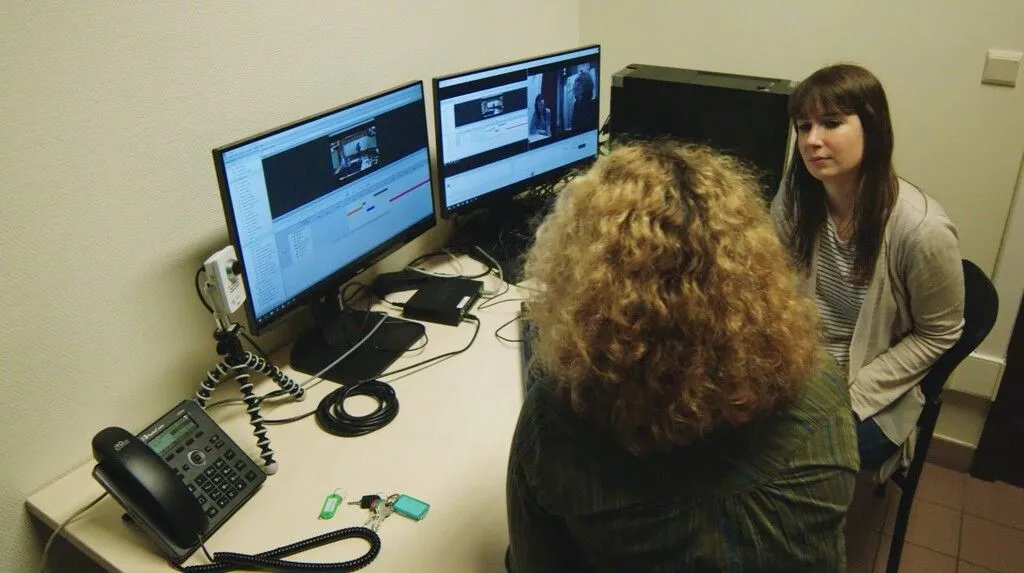
Improve teacher practices - University of Mons
Innovative tools to analyze interactions
Marie Bocquillon works with two labs: one for recording trainee teachers during lessons, and one for reviewing annotated video feedback. During debriefing, the supervisor and trainee review and discuss the recorded lesson together.
Frequently asked questions
About The Observer
The Observer allows you to integrate a wide range of data streams, including video, audio, physiological data (such as heart rate or skin conductance), eye tracking, facial expressions, EEG, and more. The specific number will depend on the project set-up and the types of equipment or sensors being used.
Important factors for the system requirements include the use of video, the amount of data, the complexity of data selections and analyses, and the size of external data files. For optimal performance and functionality, an up-to-date computer system is strongly recommended.
With Pocket Observer, the mobile companion to The Observer, you can code behavior in real-world settings while participants are on the move. Whether participants are moving on a playground, in a store, or in a museum, you can capture detailed observational data unobtrusively using its intuitive interface. Data can later be synchronized for further analysis within The Observer.
The Observer offers a Coder license that allows multiple observers to code behavior simultaneously within the same research project. Using The Observer Coder license allows for coding and visualization only. After all behaviors are coded, you can collect the observations in your main project with a full license of The Observer and perform data selection, visualization, and analysis.
Yes. The Observer integrates with uLog for logging external events, uASQ for collecting questionnaire data, and E-Prime for stimulus presentation. This allows you to synchronize behavioral observations with experimental events and self-report data in one unified, time-aligned dataset.
Ready to get started?
Let's talk about your research
Whether you're setting up a new observation lab, upgrading your coding tools, or need a custom quote - we're here to help. Tell us about your research and we'll find the right setup for you.